

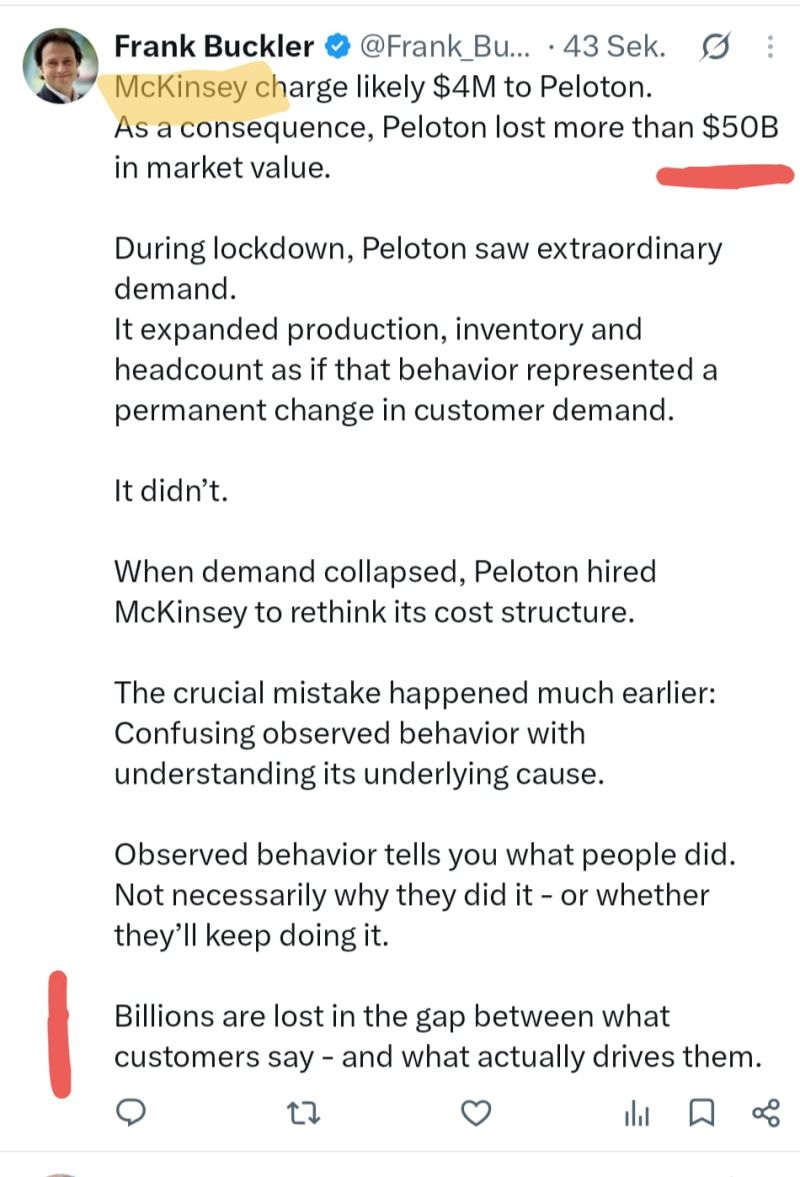
McKinsey's fee to Peloton was likely around $3M.
Peloton went on to lose more than $50B in market value.
Those are the figures in circulation, not audited numbers from my desk. Take them as reported. Correct them however you like, the ratio holds: the fee is a rounding error and the destruction is not.
But the consulting engagement is not the story here. It arrived late. By the time anyone was asked to rethink the cost structure, the expensive mistake was already three years old.
The data was real. That was the problem.
During lockdown, Peloton saw extraordinary demand.
Not stated intent. Not purchase-intent scores. Not a focus group nodding along to a concept board. Actual purchases, actual revenue, actual waiting lists. The hardest kind of data there is.
So the company expanded production, inventory and headcount as if that behaviour represented a permanent change in customer demand.
It didn't.
Notice what this case is not. Nobody lied in a survey. There is no say-do gap to blame, because nothing here rested on what people said. The behavioural data was clean, complete, and it still walked an entire leadership team off a cliff.
Behavioural data is supposed to be the safe kind. That belief is what makes this expensive.
What observed behaviour actually tells you
It tells you what. It never tells you why.
A purchase is an outcome, and outcomes are cheap. Many different causes produce exactly the same one.
Think about somebody buying a Peloton in April 2020. Why?
- Their gym was closed and there was no substitute available.
- They had genuinely shifted to preferring home workouts, permanently.
- They were bored, at home, with discretionary money they could not spend on travel.
- Three people in their feed had just bought one.
Four completely different causes. Four identical rows in the sales database. Same revenue, same growth curve, same triumphant slide.
Only one of those causes survives gyms reopening.
And here is the part that matters for anyone running a capacity decision: you cannot forecast without the cause. You can only extrapolate. Extrapolation silently assumes the cause stays constant, which is precisely the thing nobody measured. The trend line looks like evidence about the future. It is a fact about the past wearing a costume.
The Observed Behaviour Fallacy
Let me name it, because it deserves a name.
The Observed Behaviour Fallacy is the error of treating recorded behaviour as an explanation of demand. The record shows what happened. It cannot show why, and therefore it cannot show whether it will continue.
There are three ways to be wrong about demand, and most companies only defend against the first one.
1. What people say is not what they do
The classic say-do gap. Stated preference diverges from real behaviour because the conscious mind narrates decisions it did not make. Everyone in insights knows this one. It is the reason "we use behavioural data" became a respectable answer.
2. Attention is not demand
People can find something fascinating and never give anything up for it. That is what happened to Meta's metaverse: interest costs the respondent nothing, demand always costs something.
3. What people did is not why they did it
This is the one nobody guards against. And it is the most dangerous of the three, because unlike the other two, it does not look like soft data. It looks like proof. It arrives in a dashboard, in a chart that goes up and to the right, with a source everyone trusts.
Wrong remains wrong. But wrong that looks rigorous gets funded faster.
Why nobody in the room objected
Because the numbers were going up.
Nobody commissions a study into whether their growth is real while they are having the best quarter in company history. That would be an odd meeting to call. In practice, the research budget opens after the decline, when the question has already collapsed from "do we understand our customers" into "where do we cut."
Which is backwards. A boom is exactly when the confounder is invisible, and exactly when the capital is being committed. Peloton did not need better cost advice in 2022. It needed one uncomfortable question in 2020: what would have to be true for this behaviour to persist, and has anyone measured it?
That question costs a fraction of a percent of what the answer was eventually worth. It is also the same failure sequence behind Ford's $19.5B EV write-off: the demand question got asked properly only after the capital was already gone. Different industry, different direction of error, identical ordering mistake.
This is what a wrong market research insight actually costs, and it is never booked against the budget that produced it.
Four questions before you scale on a demand signal
- What would have to disappear for this to stop? If the honest answer is a temporary condition, you are looking at a constraint, not a preference.
- Have we measured the driver, or only the outcome? Revenue is the outcome. The driver is upstream and has to be measured separately.
- Can we separate the cohorts by motive rather than by demographics? Two customers with the same profile and the same purchase can have opposite reasons.
- What result would have stopped this decision? If no result could have stopped it, the analysis was decoration.
Measuring the cause, not the record
You cannot get at this by asking, because respondents will construct a reason on the spot and it will sound entirely plausible. Customers cannot tell you why they buy, and the more confident the answer, the more it was assembled after the fact.
So you measure differently. Implicit, reaction-time based measurement captures what the category is actually linked to before anyone builds an explanation for you. Then Causal AI does the part that correlation cannot: it separates the drivers that move purchase when you move them from the ones that merely travel alongside it.
That is the whole point of Frame, Measure, Infer. Not a nicer dashboard. A different question.
Because a dashboard built on outcomes will show you the boom in perfect resolution and tell you nothing about whether it is yours to keep. Roughly 5% of brands grow sustainably, and the ones that do are not the ones with the cleanest reporting. They are the ones who went and found the actual drivers while things were still going well.
Billions are lost in the gap between what customers say and what actually drives them. And a further pile is lost in the narrower gap nobody talks about: between what customers did, and why.
So look at the growth curve on your own deck this quarter. Do you know what is holding it up?
Observed behaviour and demand: frequently asked questions
What is the observed behaviour fallacy?
It is the error of treating recorded behaviour as an explanation of demand. Behavioural data is a record of outcomes, and several different causes produce identical outcomes. A purchase driven by a temporary constraint looks exactly like a purchase driven by a permanent preference change. Because the cause was never measured, any forecast built on the trend is extrapolating an assumption while appearing to extrapolate a fact.
Why did Peloton's own growth data mislead its leadership?
Because the data was clean and still uninformative. During lockdown Peloton saw extraordinary demand, and it expanded production, inventory and headcount as if that behaviour represented a permanent change in customer demand. Nobody had lied in a survey. The purchases were real. What was missing was the reason behind them, and the reason was the only thing that determined whether the behaviour would survive gyms reopening.
How do you tell temporary demand from permanent demand?
By measuring the driver rather than the outcome. Implicit, reaction-time based measurement captures what a category is actually associated with, before a respondent constructs an explanation. Causal modelling then separates the drivers that move purchase when you move them from the ones that merely travel alongside it. If demand is held up by a constraint that will disappear, that shows up as a driver, not as a dip in the trend line.
When should a company test its demand assumptions?
While the numbers are still going up. That is the counterintuitive part. Research budgets are typically released after a decline, when the question has already narrowed to cost. During a boom nobody wants to interrogate the boom, which is exactly when a confounded cause is invisible and when capital is being committed against it. The demand question belongs before the capacity decision, not after the write-down.
Dr. Frank Buckler advises leadership teams on growth decisions that depend on why customers choose. He founded SUPRA, holds a PhD in marketing and was among the first to apply causal AI to marketing questions. His latest book is THE TOP 5%.
